
Page 31 - gfs0817_Magazine
P. 31
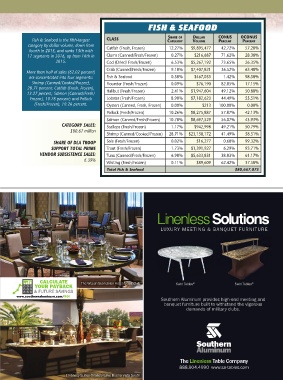
FISH & SEAFOOD

                                                                                   Dollar
                                                                        Share of
                Fish & Seafood is the fifth-largest   CLASS             Category  Volume     CoNuS    oCoNuS
                                                                                                       PerCeNt
                                                                                             PerCeNt
              category by dollar volume, down from   Catfish (Fresh, Frozen)  12.27%   $9,895,477   42.72%  57.28%
               fourth in 2015, and ranks 15th with
              17 segments in 2016, up from 16th in   Clams (Canned/Fresh/Frozen)  0.27%   $216,687   71.62%  28.38%
                          2015.                Cod (Dried/ Fresh/Frozen)  6.53%   $5,267,192   73.65%   26.35%
                                               Crab (Canned/Fresh/Frozen)  9.18%   $7,407,821   36.52%  63.48%
              More than half of sales (62.02 percent)
               are concentrated into four segments:   Fish & Seafood      0.58%     $467,035   1.42%    98.58%
                Shrimp (Canned/Cooked/Frozen),   Flounder (Fresh/Frozen)  0.09%      $76,190   82.85%   17.15%
              28.71 percent; Catfish (Fresh, Frozen),
              12.27 percent; Salmon (Canned/Fresh/  Halibut (Fresh/Frozen)  2.41%   $1,947,604   49.12%  50.88%
               Frozen), 10.78 percent; and Pollock   Lobster (Fresh/Frozen)  8.90%   $7,182,623   44.49%  55.51%
                 (Fresh/Frozen), 10.26 percent.  Oysters (Canned, Fresh, Frozen)  0.00%   $213   100.00%  0.00%
                                               Pollock (Fresh/Frozen)    10.26%   $8,275,887   57.87%   42.13%
                                               Salmon (Canned/Fresh/Frozen)  10.78%   $8,697,529   56.07%  43.93%
                            CATEGORY SALES:    Scallops (Fresh/Frozen)    1.17%     $942,998   49.21%   50.79%
                                $80.67 million
                                               Shrimp (Canned/Cooked/Frozen)  28.71%   $23,158,172   41.49%  58.51%
                         SHARE OF DLA TROOP    Sole (Fresh/Frozen)        0.02%      $16,277   0.68%    99.32%
                        SUPPORT TOTAL PRIME    Trout (Fresh/Frozen)       1.73%   $1,391,927   6.29%    93.71%
                   VENDOR SUBSISTENCE SALES:   Tuna (Canned/Fresh/Frozen)  6.98%   $5,633,831   38.83%  61.17%
                                      6.39%
                                               Whiting (Fresh/Frozen)     0.11%      $89,609   62.42%   37.58%
                                               Total Fish & Seafood                                 $80,667,075


                                                                    Linenless Solutions

                                                                     LUXURY MEETING & BANQUET FURNITURE


                   CALCULATE        The Westin Stonebriar Hotel & Golf Club        ®                       ®
                 YOUR PAYBACK                                               Swirl Tables            Swirl Tables
                 & FUTURE SAVINGS
          www.southernaluminum.com/ROI
                                                                     Southern Aluminum provides high-end meeting and
                                                                       banquet furniture built to withstand the vigorous
                                                                                demands of military clubs.


                                                                             The Linenless Table Company
                                                                             888.904.4990  www.sa-tables.com
                              Embassy Suites Orlando Lake Buena Vista South