
Page 34 - gfs0817_Magazine
P. 34
SPV MARKET TRENDS
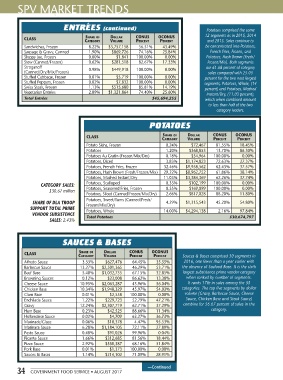
ENTRÉES (continued) Potatoes comprised the same
CLASS Share of Dollar CoNuS oCoNuS 12 segments as in 2015, 2014
Category Volume PerCeNt PerCeNt and 2013. Sales continue to
Sandwiches, Frozen 8.22% $3,757,158 56.51% 43.49% be concentrated into Potatoes,
Sausage & Gravy, Canned 1.90% $869,726 74.16% 25.84% French Fries, Frozen, and
Sloppy Joe, Frozen 0.00% $1,841 100.00% 0.00% Potatoes, Hash Brown (Fresh/
Stew (Canned/Frozen) 0.62% $281,518 82.67% 17.33% Frozen/Mix). Both segments
Stroganoff 0.98% $449,918 100.00% 0.00% are 61.68 percent of category
(Canned/Dry/Mix/Frozen) sales compared with 25.03
Stuffed Cabbage, Frozen 0.01% $5,719 100.00% 0.00% percent for the two next largest
Stuffed Peppers, Frozen 0.02% $7,832 100.00% 0.00% segments, Potatoes, Whole, (14
Swiss Steak, Frozen 1.13% $515,680 85.81% 14.19% percent) and Potatoes, Mashed
Vegetarian Entrées 2.89% $1,321,864 74.40% 25.60% Instant/Dry, (11.03 percent),
Total Entrées $45,694,255 which when combined amount
to less than half of the two
category leaders.
POTATOES
CLASS Share of Dollar CoNuS oCoNuS
Category Volume PerCeNt PerCeNt
Potato Skins, Frozen 0.24% $72,467 81.55% 18.45%
Potatoes 1.20% $368,853 13.70% 86.30%
Potatoes Au Gratin (Frozen/Mix/Dry) 0.18% $54,964 100.00% 0.00%
Potatoes, Diced 3.83% $1,174,823 72.63% 27.37%
Potatoes, French Fries, Frozen 32.46% $9,958,562 62.43% 37.57%
Potatoes, Hash Brown (Fresh/Frozen/Mix) 29.22% $8,962,752 61.86% 38.14%
Potatoes, Mashed Instant/Dry 11.03% $3,384,369 62.26% 37.74%
CATEGORY SALES: Potatoes, Scalloped 0.33% $102,199 100.00% 0.00%
$30.67 million Potatoes, Seasoned Fries, Frozen 0.55% $169,099 100.00% 0.00%
Potatoes, Sliced (Canned/Frozen/Mix/Dry) 2.66% $817,028 88.20% 11.80%
Potatoes, Sweet/Yams (Canned/Fresh/
SHARE OF DLA TROOP Frozen/Mix/Dry) 4.29% $1,315,543 45.20% 54.80%
SUPPORT TOTAL PRIME Potatoes, Whole 14.00% $4,294,138 2.16% 97.84%
VENDOR SUBSISTENCE Total Potatoes $30,674,797
SALES: 2.43%
SAUCES & BASES
CLASS Share of Dollar CoNuS oCoNuS
Category Volume PerCeNt PerCeNt Sauces & Bases comprised 30 segments in
Alfredo Sauce 3.33% $627,476 64.45% 35.55% 2016, one fewer than a year earlier with
Barbecue Sauce 13.27% $2,501,365 46.29% 53.71% the absence of Seafood Base. It is the sixth
Beef Base 5.48% $1,032,755 67.15% 32.85% largest subsistence prime vendor category
Browning Sauces 0.12% $23,008 86.62% 13.38% when ranked by number of segments.
Cheese Sauce 10.95% $2,063,287 43.96% 56.04% It ranks 17th in sales among the 35
Chicken Base 10.34% $1,948,329 45.97% 54.03% categories. The top five segments by dollar
Clam Base 0.01% $2,558 100.00% 0.00% volume (Gravy, Barbecue Sauce, Cheese
Enchilada Sauce 1.22% $229,723 52.79% 47.21% Sauce, Chicken Base and Steak Sauce)
Gravy 12.24% $2,307,719 62.71% 37.29% combine for 56.67 percent of sales in the
Ham Base 0.23% $42,525 88.66% 11.34% category.
Hollandaise Sauce 0.02% $4,709 63.27% 36.73%
Marinade/Glaze 0.06% $10,378 4.47% 95.53%
Marinara Sauce 6.28% $1,184,105 72.11% 27.89%
Pesto Sauce 0.48% $91,026 99.96% 0.04%
Picante Sauce 1.66% $312,685 81.56% 18.44%
Pizza Sauce 2.92% $550,387 68.16% 31.84%
Pork Base 0.01% $1,373 100.00% 0.00%
Sauces & Bases 1.14% $214,102 71.09% 28.91%
34 GOVERNMENT FOOD SERVICE • AUGUST 2017 —Continued