
Page 36 - gfs0817_Magazine
P. 36
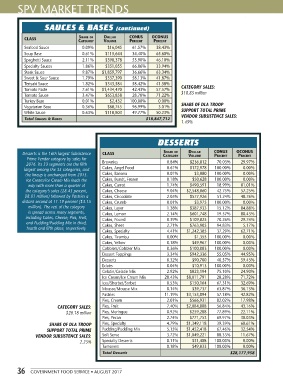
SPV MARKET TRENDS


                     SAUCES & BASES (continued)

             CLASS                 Share of   Dollar    CoNuS     oCoNuS
                                   Category   Volume    PerCeNt   PerCeNt
             Seafood Sauce           0.09%      $16,045   61.57%   38.43%
             Soup Base               0.61%     $115,644   34.40%   65.60%
             Spaghetti Sauce         2.11%     $398,378   53.90%   46.10%
             Specialty Sauces        1.86%     $351,055   66.06%   33.94%
             Steak Sauce             9.87%   $1,859,797   36.66%   63.34%
             Sweet & Sour Sauce      1.79%     $337,390   58.13%   41.87%
             Teriyaki Sauce          1.82%     $343,584   58.42%   41.58%     CATEGORY SALES:
             Tomato Paste            7.61%   $1,434,470   42.43%   57.57%     $18.85 million
             Tomato Sauce            3.47%     $653,858   28.78%   71.22%
             Turkey Base             0.01%       $2,432   100.00%   0.00%
             Vegetarian Base         0.36%      $68,745   96.99%    3.01%     SHARE OF DLA TROOP
             White Sauce             0.63%     $118,803   49.77%   50.23%     SUPPORT TOTAL PRIME
                                                                              VENDOR SUBSISTENCE SALES:
             Total Sauces & Bases                              $18,847,712
                                                                              1.49%


                                                                    DESSERTS


                                                                                 Dollar
                                                                      Share of
            Desserts is the 16th largest Subsistence   CLASS          Category   Volume    CoNuS     oCoNuS
                                                                                                     PerCeNt
                                                                                           PerCeNt
              Prime Vendor category by sales for
              2016. Its 33 segments are the fifth   Brownies            0.84%     $236,812   70.03%   29.97%
             largest among the 35 categories, and   Cakes, Angel Food   0.61%     $172,978   100.00%   0.00%
             the lineup is unchanged from 2015.   Cakes, Banana         0.01%       $3,080   100.00%   0.00%
              Ice Cream/Ice Cream Mix leads the   Cakes, Bundt, Frozen  0.18%      $50,628   100.00%   0.00%
              way with more than a quarter of   Cakes, Carrot           1.74%     $490,591   18.99%   81.01%
             the category’s sales (28.43 percent,   Cakes, Cheese       9.04%   $2,548,060   42.75%   57.25%
             $8.01 million) followed by Pastries a   Cakes, Chocolate   2.05%     $577,926   51.24%   48.76%
            distant second at 11.19 percent ($3.15   Cakes, Crumb       0.01%       $3,975   100.00%   0.00%
              million). The rest of the category   Cakes, Layer         1.38%     $387,933   15.12%   84.88%
              is spread across many segments,   Cakes, Lemon            2.14%     $601,748   19.57%   80.43%
             including Cakes, Cheese; Pies, Fruit,   Cakes, Pound       0.39%     $109,825   70.26%   29.74%
              and Pudding/Pudding Mix in third,   Cakes, Sheet          2.71%     $763,905   94.83%    5.17%
              fourth and fifth place, respectively.
                                             Cakes, Specialty           4.41%   $1,242,385   37.29%   62.71%
                                             Cakes, Tiramisu            0.00%       $1,355   100.00%   0.00%
                                             Cakes, Yellow              0.18%      $49,967   100.00%   0.00%
                                             Cobblers/Cobbler Mix       0.36%     $100,083   100.00%   0.00%
                                             Dessert Toppings           3.34%     $942,336   55.05%   44.95%
                                             Desserts                   0.32%      $90,700   40.57%   59.43%
                                             Eclairs                    0.04%      $10,913   100.00%   0.00%
                                             Gelatin/Gelatin Mix        2.92%     $823,194   75.10%   24.90%
                                             Ice Cream/Ice Cream Mix   28.43%   $8,011,791   28.28%   71.72%
                                             Ices/Sherbet/Sorbet        0.53%     $150,164   67.31%   32.69%
                                             Mousse/Mousse Mix          0.14%      $39,737   63.87%   36.13%
                                             Pastries                  11.19%   $3,153,094   57.18%   42.82%
                                             Pies, Cream                2.01%     $566,931   82.02%   17.98%
                           CATEGORY SALES:   Pies, Fruit                7.40%   $2,084,808   56.84%   43.16%
                              $28.18 million  Pies, Meringue            0.92%     $259,288   77.89%   22.11%
                                             Pies, Pecan                2.74%     $771,753   69.97%   30.03%
                       SHARE OF DLA TROOP    Pies, Specialty            4.79%   $1,349,118   39.39%   60.61%
                      SUPPORT TOTAL PRIME    Pudding/Pudding Mix        5.15%   $1,452,418   67.46%   32.54%
                 VENDOR SUBSISTENCE SALES:   Soft Serve                 3.72%   $1,049,221   88.33%   11.67%
                                    2.23%    Specialty Desserts         0.11%      $31,408   100.00%   0.00%
                                             Turnovers                  0.18%      $49,833   100.00%   0.00%
                                             Total Desserts                                       $28,177,958


          36   GOVERNMENT FOOD SERVICE • AUGUST 2017