
Page 38 - gfs0817_Magazine
P. 38
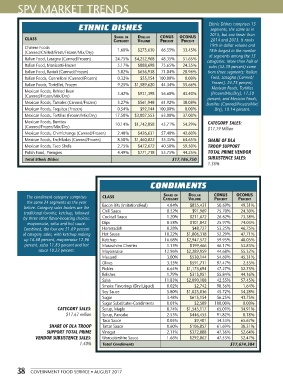
SPV MARKET TRENDS


                                   ETHNIC DISHES                                         Ethnic Dishes comprises 15
                                                                                          segments, the same as in
             CLASS                                Share of  Dollar   CoNuS   oCoNuS       2015, but one fewer than
                                                                                          2014 and 2013. It ranks
                                                  Category  Volume   PerCeNt  PerCeNt
             Chinese Foods                         1.60%    $275,630   66.55%  33.45%    19th in dollar volume and
             (Canned/Chilled/Fresh/Frozen/Mix/Dry)                                       18th largest in the number
                                                                                         of segments among the 35
             Italian Food, Lasagna (Canned/Frozen)  24.75%   $4,252,968   48.35%  51.65%  categories. More than half of
             Italian Food, Manicotti-Frozen        5.17%    $888,698   75.65%  24.35%    sales (52.39 percent) come
             Italian Food, Ravioli (Canned/Frozen)  3.82%   $656,938   71.04%  28.96%    from three segments: Italian
             Italian Foods, Cannelloni (Canned/Frozen)  0.32%   $55,154  100.00%  0.00%   Food, Lasagna (Canned/
             Italian Foods, Tortellini, Frozen     9.25%   $1,589,620   44.34%  55.66%    Frozen), 24.75 percent;
                                                                                          Mexican Foods, Tortillas
             Mexican Foods, Refried Bean           5.42%    $931,398   56.60%  43.40%     (Frozen/Mix/Dry), 17.50
             (Canned/Frozen/Mix/Dry)                                                     percent, and Mexican Foods,
             Mexican Foods, Tamales (Canned/Frozen)  3.27%   $561,948   61.92%  38.08%  Burritos (Canned/Frozen/Mix/
             Mexican Foods, Taquitos (Frozen)      0.54%     $92,144  100.00%  0.00%       Dry), 10.14 percent.
             Mexican Foods, Tortillas (Frozen/Mix/Dry)  17.50%   $3,007,553   63.00%  37.00%
             Mexican Foods, Burritos              10.14%   $1,742,858   45.71%  54.29%   CATEGORY SALES:
             (Canned/Frozen/Mix/Dry)                                                     $17.19 Million
             Mexican Foods, Chimichanga (Canned/Frozen)  2.48%   $426,631   57.40%  42.60%
             Mexican Foods, Enchiladas (Canned/Frozen)  8.50%   $1,460,822   35.35%  64.65%  SHARE OF DLA
             Mexican Foods, Taco Shells            2.75%    $472,672   40.50%  59.50%    TROOP SUPPORT
             Polish Food, Pierogies                4.49%    $771,718   55.75%  44.25%    TOTAL PRIME VENDOR
             Total Ethnic Dishes                                          $17,186,750    SUBSISTENCE SALES:
                                                                                         1.36%


                                                                 CONDIMENTS


              The condiment category comprises   CLASS                Share of   Dollar    CoNuS     oCoNuS
              the same 24 segments as the year                        Category   Volume    PerCeNt   PerCeNt
             before. Category sales leaders are the   Bacon Bits (Imitation/Real)  4.84%   $855,431   50.69%  49.31%
             traditional favorite, ketchup, followed   Chili Sauce      0.52%      $91,969   75.70%   24.30%
            by three other flavor-boosting choices:   Cocktail Sauce    1.20%     $211,672   26.62%   73.38%
              mayonnaise, salsa and hot sauce.   Dips                   0.58%     $101,842   25.97%   74.03%
             Combined, the four are 51.69 percent   Horseradish         0.28%      $48,727   53.25%   46.75%
            of category sales, with ketchup making   Hot Sauce         10.22%   $1,806,318   52.29%   47.71%
             up 16.68 percent, mayonnaise 12.96   Ketchup              16.68%   $2,947,572   59.95%   40.05%
             percent, salsa 11.83 percent and hot   Maraschino Cherries  1.13%    $199,466   46.17%   53.83%
                   sauce 10.22 percent.      Mayonnaise                12.96%   $2,289,959   44.68%   55.32%
                                             Mustard                    3.00%     $530,144   54.69%   45.31%
                                             Olives                     3.35%     $591,711   97.47%    2.53%
                                             Pickles                    6.64%   $1,173,694   47.27%   52.73%
                                             Relishes                   1.79%     $315,951   55.84%   44.16%
                                             Salsa                     11.83%   $2,090,108   42.55%   57.45%
                                             Smoke Flavorings (Dry/Liquid)  0.02%   $2,742   98.36%    1.64%
                                             Soy Sauce                  5.80%   $1,025,836   45.72%   54.28%
                                             Sugar                      3.48%     $615,154   56.25%   43.75%
                                             Sugar Substitutes-Condiments  0.01%    $2,509   100.00%   0.00%
                           CATEGORY SALES:   Syrup, Maple               8.74%   $1,545,117   65.09%   34.91%
                              $17.67 million  Syrup, Pancake            2.53%     $446,455   91.82%    8.18%
                                             Taco Sauce                 0.05%       $9,401   34.33%   65.67%
                       SHARE OF DLA TROOP    Tartar Sauce               0.60%     $106,857   61.69%   38.31%
                      SUPPORT TOTAL PRIME    Vinegar                    2.11%     $372,888   47.36%   52.64%
                 VENDOR SUBSISTENCE SALES:   Worcestershire Sauce       1.66%     $292,862   47.53%   52.47%
                                    1.40%    Total Condiments                                     $17,674,384


          38   GOVERNMENT FOOD SERVICE • AUGUST 2017