
Page 4 - gfs0818_Magazine
P. 4
MARKET TRENDS
Subsistence Prime Vendor Sales in Review
Sales in 35 Categories and Segment Breakdowns in Each
efense Logistics Agency (DLA) Troop categories by class (or segment), percent- consecutive year. It accounts for 20.3 per-
DSupport in Philadelphia held 53 age of market share within the category, cent of Subsistence Prime Vendor sales in
prime vendor contracts with 21 food dollar volume and percentage within each 2017, which is down only slightly from
distributors worldwide in calendar 2017. class (segment) sold within the continental 20.8 percent in 2016 and 20.9 percent in
Annual combined subsistence sales for United States (CONUS) and outside the 2015, but higher than 19.4 percent in 2014.
fiscal 2018 through July 20 are $2.6 bil- continental United States (OCONUS). Poultry continues in second with 2017
lion and for all of fiscal 2017 were $2.7 Of the 35 categories, the top 10 rep- sales of $148.17 million, ahead of 2016
billion, which includes subsistence and resent nearly $1.010 billion, or almost sales of $137.64 million and $132.79 mil-
food service operating supplies supplied three-quarters (73.96 percent) of overall lion in 2015 when it became the second-
by prime vendors, as well as contracting Subsistence Prime Vendor Sales during largest category by dollar volume, moving
efforts outside of the Subsistence Prime 2017. Meanwhile, the top five categories up from third in 2014. It represents 10.85
Vendor program. represent $747.6 million, or more than percent of Subsistence Prime Vendor sales,
One2OneUS LLC, based in Maple half (54.76 percent) of Subsistence Prime which is flat with 10.9 percent of in 2016,
Shade, N.J., tracks military sales and Vendor sales for the period. The next five while falling slightly from 11.14 percent
National Allowance Pricing Agreement largest categories total $262.1 million, or in 2015 and 11.15 percent in 2014.
(NAPA) allowance information so that 19.2 percent. Both are ahead of third-place Bev-
DLA Troop Support can monitor monthly As measured by dollar volume, two erages with sales of $145.7 million, or
sales of food, food service equipment and center-of-the-plate entrée staples, Meat 10.67 percent of Subsistence Prime Vendor
supplies. and Poultry, rank first and second in Sub- totals for the year, up from $125.4 mil-
The listings on the following pages re- sistence Prime Vendor dollar volume sales lion, or 9.9 percent in 2016. Beverages
cap Subsistence Prime Vendor (SPV) sales among the 35 categories. first poured into third in 2015 with sales
by category from Jan. 1, 2017, through Dec. Meat, with 2017 sales of $277.19 mil- $117.68 million (9.9 percent) after rank-
31, 2017. The data breaks down 35 food lion, is the top category for the fourth ing second in 2014 with 11.98 percent of
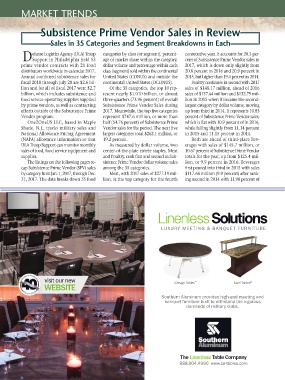
Linenless Solutions
LUXURY MEETING & BANQUET FURNITURE
visit our new iDesign Tables ™ Swirl Tables ®
WEBSITE
Southern Aluminum provides high-end meeting and
banquet furniture built to withstand the vigorous
demands of military clubs.
The Linenless Table Company
4 GOVERNMENT FOOD SERVICE • AUGUST 2018 888.904.4990 www.sa-tables.com