
Page 7 - gfs0818_Magazine
P. 7
SPV MARKET TRENDS
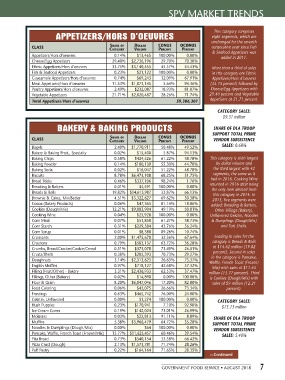
This category comprises
APPETIZERS/HORS D’OEUVRES eight segments, which are
unchanged for the seventh
CLASS Share of Dollar CoNuS oCoNuS consecutive year since Fish
Category Volume PerCeNt PerCeNt & Seafood Appetizers was
Appetizers/Hors d’oeuvres 0.14% $13,465 100.00% 0.00% added in 2011.
Cheese/Egg Appetizers 29.40% $2,736,196 29.70% 70.30%
Ethnic Appetizers/Hors d’oeuvres 33.75% $3,140,555 45.57% 54.43% More than a third of sales
Fish & Seafood Appetizers 0.23% $21,122 100.00% 0.00% in this category are Ethnic
Guacamole Appetizers/Hors d’oeuvres 0.74% $69,243 32.09% 67.91% Appetizers/Hors d’oeuvres
Meat Appetizers/Hors d’oeuvres 11.53% $1,073,145 5.64% 94.36% (33.75 percent) followed by
Poultry Appetizers/Hors d’oeuvres 2.49% $232,087 18.93% 81.07% Cheese/Egg Appetizers with
Vegetable Appetizers 21.71% $2,020,487 28.26% 71.74% 29.40 percent and Vegetable
Total Appetizers/Hors d’oeuvres $9,306,301 Appetizers at 21.71 percent.
CATEGORY SALES:
$9.31 million
BAKERY & BAKING PRODUCTS SHARE OF DLA TROOP
SUPPORT TOTAL PRIME
CLASS Share of Dollar CoNuS oCoNuS VENDOR SUBSISTENCE
Category Volume PerCeNt PerCeNt
Bagels 2.40% $1,770,911 50.48% 49.52% SALES: 0.68%
Bakery & Baking Prod., Specialty 0.02% $15,400 5.87% 94.13%
Baking Chips 0.58% $424,526 61.22% 38.78% This category is sixth largest
Baking Powder 0.14% $100,139 55.30% 44.70% by dollar volume and
Baking Soda 0.02% $16,047 51.22% 48.78% the third largest with 42
Biscuits 8.78% $6,473,108 68.25% 31.75% segments, the same as it
Bread Sticks 0.46% $337,106 98.24% 1.76% had in 2016. Cooking Wine
Breading & Batters 0.01% $4,491 100.00% 0.00% returned in 2016 after being
the only item deleted from
Breads & Rolls 19.82% $14,615,987 33.87% 66.13% this category in 2014. In
Brownie & Cakes, Mix/Batter 4.51% $3,322,627 69.62% 30.38% 2013, five segments were
Cocoa (Bakery Products) 0.06% $47,365 81.14% 18.86% added: Breading & Batters,
Cookies (Dough/Mix) 12.21% $9,003,904 49.19% 50.81% Other Fillings (Bakery),
Cooking Wine 0.04% $25,928 100.00% 0.00% Unflavored Gelatin, Noodles
Corn Meal 0.07% $51,850 61.27% 38.73% & Dumplings (Dough/Mix)
Corn Starch 0.31% $229,584 43.76% 56.24% and Tart Shells.
Corn Syrup 0.01% $8,380 89.26% 10.74%
Croissants 2.00% $1,475,670 32.36% 67.64% Leading in sales for the
Croutons 0.79% $583,137 63.72% 36.28% category is Breads & Rolls
Crumbs, Bread/Cracker/Cookie/Cereal 0.51% $373,078 73.49% 26.51% at $14.62 million (19.82
Crusts/Shells 0.38% $282,393 70.73% 29.27% percent). Second in sales
in the category is Pancake,
Doughnuts 3.14% $2,313,623 26.63% 73.37% Waffle, French Toast (Frozen/
English Muffins 0.97% $718,127 42.68% 57.32% Mix) with sales of $11.63
Filling (Fruit/Other) - Bakery 3.31% $2,436,933 62.53% 37.47% million (15.77 percent). Third
Fillings, Other (Bakery) 0.02% $14,890 0.00% 100.00% is Cookies (Dough/Mix) with
Flour & Grain 8.20% $6,047,046 17.20% 82.80% sales of $9 million (12.21
Food Coloring 0.06% $43,075 26.66% 73.34% percent).
Frostings 0.63% $465,742 76.00% 24.00%
Gelatin, Unflavored 0.00% $1,274 100.00% 0.00% CATEGORY SALES:
Hush Puppies 0.23% $170,941 7.10% 92.90% $73.73 million
Ice Cream Cones 0.19% $142,024 73.01% 26.99%
Molasses 0.03% $22,813 91.11% 8.89% SHARE OF DLA TROOP
Muffins 5.38% $3,966,479 64.72% 35.28% SUPPORT TOTAL PRIME
Noodles & Dumplings (Dough/Mix) 0.00% $64 100.00% 0.00% VENDOR SUBSISTENCE
Pancake, Waffle, French Toast (Frozen/Mix) 15.77% $11,625,457 60.46% 39.54% SALES: 5.40%
Pita Bread 0.73% $540,154 33.58% 66.42%
Pizza Crust (Dough) 2.13% $1,573,781 71.74% 28.26%
Puff Pastry 0.22% $164,164 71.65% 28.35%
—Continued
7
GOVERNMENT FOOD SERVICE • AUGUST 2018