
Page 12 - gfs0818_Magazine
P. 12
SPV MARKET TRENDS
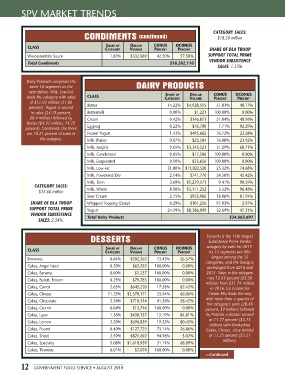
CONDIMENTS (continued) CATEGORY SALES:
$18.20 million
CLASS Share of Dollar CoNuS oCoNuS
Category Volume PerCeNt PerCeNt SHARE OF DLA TROOP
Worcestershire Sauce 1.83% $332,989 42.50% 57.50% SUPPORT TOTAL PRIME
VENDOR SUBSISTENCE
Total Condiments $18,202,110
SALES: 1.33%
Dairy Products comprises the
same 16 segments as the DAIRY PRODUCTS
year before. Milk, Low-Fat
Dollar
Share of
leads the category with sales CLASS Category Volume CoNuS oCoNuS
PerCeNt
PerCeNt
of $11.02 million (31.80
percent). Yogurt is second Butter 14.22% $4,928,515 51.83% 48.17%
in sales (24.19 percent, Buttermilk 0.00% $1,221 100.00% 0.00%
$8.4 million) followed by Cream 0.42% $146,811 51.04% 48.96%
Butter ($4.93 million, 14.22
percent). Combined, the three Eggnog 0.22% $76,700 7.71% 92.29%
are 70.21 percent of sales in Frozen Yogurt 1.43% $495,662 76.72% 23.28%
the category. Milk Shakes 0.07% $23,584 76.08% 23.92%
Milk, Aseptic 9.65% $3,343,521 31.29% 68.71%
Milk, Condensed 0.05% $17,586 100.00% 0.00%
Milk, Evaporated 0.10% $33,656 100.00% 0.00%
Milk, Low-Fat 31.80% $11,022,520 25.32% 74.68%
Milk, Powdered/Dry 2.14% $741,770 54.58% 45.42%
Milk, Skim 3.69% $1,279,571 9.41% 90.59%
CATEGORY SALES:
$34.66 million Milk, Whole 8.98% $3,111,252 3.52% 96.48%
Sour Cream 2.75% $953,966 18.06% 81.94%
SHARE OF DLA TROOP Whipped Topping (Dairy) 0.29% $101,256 97.03% 2.97%
SUPPORT TOTAL PRIME Yogurt 24.19% $8,386,099 52.69% 47.31%
VENDOR SUBSISTENCE Total Dairy Products $34,663,691
SALES: 2.54%.
DESSERTS Desserts is the 15th largest
Subsistence Prime Vendor
CLASS Share of Dollar CoNuS oCoNuS category by sales for 2017.
Category Volume PerCeNt PerCeNt Its 33 segments are fifth
Brownies 0.64% $202,262 73.43% 26.57% largest among the 35
categories, and the lineup is
Cakes, Angel Food 0.20% $63,292 100.00% 0.00% unchanged from 2016 and
Cakes, Banana 0.00% $1,257 100.00% 0.00% 2015. Sales in the category
rose 12.63 percent ($3.56
Cakes, Bundt, Frozen 0.25% $79,783 100.00% 0.00%
million) from $31.74 million
Cakes, Carrot 2.03% $645,220 17.58% 82.42% in 2016. Ice Cream/Ice
Cakes, Cheese 11.25% $3,570,171 33.94% 66.06% Cream Mix leads the way
with more than a quarter of
Cakes, Chocolate 2.24% $710,314 41.58% 58.42%
the category’s sales (28.40
Cakes, Crumb 0.04% $13,746 100.00% 0.00% percent, $9 million) followed
Cakes, Layer 1.36% $430,157 15.19% 84.81% by Pastries a distant second
at 11.77 percent ($3.73
Cakes, Lemon 2.20% $696,859 19.55% 80.45%
million) with third-place
Cakes, Pound 0.40% $127,723 73.14% 26.86% Cakes, Cheese, close behind
Cakes, Sheet 2.59% $821,692 94.98% 5.02% at 11.25 percent ($3.57
million).
Cakes, Specialty 5.08% $1,610,959 31.11% 68.89%
Cakes, Tiramisu 0.01% $2,074 100.00% 0.00%
—Continued
12 GOVERNMENT FOOD SERVICE • AUGUST 2018