Page 14 - gfs0818_Magazine
P. 14

SPV MARKET TRENDS


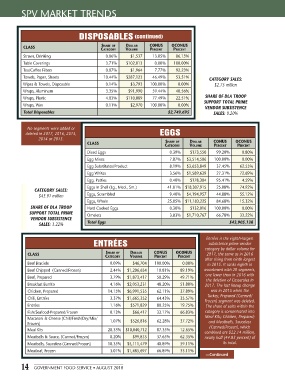
                                  DISPOSABLES             (continued)


           CLASS                            Share of  Dollar    CoNuS     oCoNuS
                                            Category  Volume    PerCeNt   PerCeNt
           Straws, Drinking                   0.06%      $1,537   13.85%   86.15%
           Table Coverings                    3.71%    $102,013   0.00%   100.00%
           Tea/Coffee Filters                 0.07%      $1,964   7.77%    92.23%
           Towels, Paper, Sheets             10.44%    $287,123   46.49%   53.51%        CATEGORY SALES:
           Wipes & Towels, Disposable         0.14%      $3,793   100.00%   0.00%           $2.75 million
           Wraps, Aluminum                    3.35%     $91,990   59.44%   40.56%
           Wraps, Plastic                     4.03%    $110,889   77.49%   22.51%       SHARE OF DLA TROOP
                                                                                       SUPPORT TOTAL PRIME
           Wraps, Wax                         0.11%      $2,970   100.00%   0.00%
                                                                                        VENDOR SUBSISTENCE
           Total Disposables                                            $2,749,695         SALES: 0.20%


             No segments were added or
            deleted in 2017, 2016, 2015,                             EGGS
                 2014 or 2013.
                                      CLASS                            Share of  Dollar    CoNuS     oCoNuS
                                                                       Category  Volume    PerCeNt   PerCeNt
                                      Diced Eggs                         0.39%    $173,550   99.20%    0.80%
                                      Egg Mixes                          7.87%   $3,514,506   100.00%  0.00%
                                      Egg Substitutes/Product            8.19%   $3,653,849   37.45%  62.55%
                                      Egg Whites                         3.56%   $1,589,639   27.31%  72.69%
                                      Egg, Patties                       0.40%    $178,304   95.41%    4.59%
                                      Eggs In Shell (Lg., Med., Sm.)    41.01%  $18,307,915   25.08%  74.92%
                CATEGORY SALES:
                 $43.91 million       Eggs, Scrambled                    9.40%   $4,194,957   44.88%  55.12%
                                      Eggs, Whole                       25.05%  $11,183,225   84.68%  15.32%
              SHARE OF DLA TROOP      Hard Cooked Eggs                   0.30%    $132,016   100.00%   0.00%
             SUPPORT TOTAL PRIME      Omelets                            3.83%   $1,710,767   66.78%  33.22%
              VENDOR SUBSISTENCE
                 SALES: 3.22%         Total Eggs                                                  $43,905,138


                                                                                        Entrées is the eighth-largest
                                         ENTRÉES                                         subsistence prime vendor
                                                                                        category by dollar volume for
             CLASS                            Share of  Dollar    CoNuS    oCoNuS       2017, the same as in 2016
                                              Category  Volume    PerCeNt   PerCeNt
                                                                                        after rising from ninth largest
             Beef Braciole                      0.09%     $46,704   100.00%   0.00%      in 2015. It ranks eighth in
             Beef Chipped  (Canned/Frozen)      2.44%   $1,206,654   10.81%  89.19%    assortment with 28 segments,
                                                                                        one fewer than in 2016 with
             Beef, Prepared                     3.79%   $1,873,417   50.29%  49.71%
                                                                                        the deletion of Casseroles in
             Breakfast Burrito                  4.16%   $2,053,231   48.20%  51.80%     2017. The last lineup change
             Chicken, Prepared                 14.15%   $6,991,535   62.11%  37.89%       was in 2015 when the
                                                                                         Turkey, Prepared (Canned/
             Chili, Entrées                     3.37%   $1,665,352   64.43%  35.57%
                                                                                        Frozen) segment was deleted.
             Entrées                            1.16%    $571,829   80.25%   19.75%     The share of sales within the
             Fish/Seafood-Prepared/Frozen       0.13%     $66,417   33.17%   66.83%     category is concentrated into
             Macaroni & Cheese (Chill/Fresh/Dry/Mix/  1.07%   $526,816   62.28%  37.72%  Meal Kits; Chicken, Prepared;
             Frozen)                                                                     and Meatballs, Sauceless
             Meal Kits                         20.33%  $10,040,712   87.35%  12.65%       (Canned/Frozen), which
                                                                                        combined are $22.14 million,
             Meatballs & Sauce, (Canned/Frozen)  0.20%    $99,833   37.65%   62.35%     nearly half (44.83 percent) of
             Meatballs, Sauceless (Canned/Frozen)  10.35%   $5,111,479   40.89%  59.11%        its total.
             Meatloaf, Frozen                   3.01%   $1,485,697   66.89%  33.11%
                                                                                        —Continued
          14   GOVERNMENT FOOD SERVICE • AUGUST 2018
   9   10   11   12   13   14   15   16   17   18   19