
Page 17 - gfs0818_Magazine
P. 17
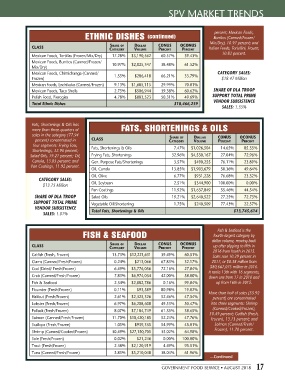
SPV MARKET TRENDS


                                                                                            percent; Mexican Foods,
                                     ETHNIC DISHES             (continued)                 Burritos (Canned/Frozen/
                                                                                          Mix/Dry), 10.97 percent; and
               CLASS                            Share of  Dollar    CoNuS    oCoNuS      Italian Foods, Tortellini, Frozen,
                                               Category   Volume    PerCeNt   PerCeNt
               Mexican Foods, Tortillas (Frozen/Mix/Dry)  17.28%   $3,190,562   60.57%  39.43%  10.82 percent.
               Mexican Foods, Burritos (Canned/Frozen/  10.97%   $2,025,347   38.48%  61.52%
               Mix/Dry)
               Mexican Foods, Chimichanga (Canned/                                           CATEGORY SALES:
               Frozen)                           1.55%     $286,418   66.21%   33.79%          $18.47 Million
               Mexican Foods, Enchiladas (Canned/Frozen)  9.13%   $1,685,115   29.99%  70.01%
               Mexican Foods, Taco Shells        2.75%     $506,944   39.38%   60.62%      SHARE OF DLA TROOP
               Polish Food, Pierogies            4.78%     $883,523   50.31%   49.69%      SUPPORT TOTAL PRIME
               Total Ethnic Dishes                                         $18,466,239     VENDOR SUBSISTENCE
                                                                                               SALES: 1.35%


              Fats, Shortenings & Oils has
               more than three-quarters of          FATS, SHORTENINGS & OILS
               sales in the category (77.94                                                  CoNuS    oCoNuS
                                                                                   Dollar
                                                                         Share of
                percent) concentrated in   CLASS                         Category  Volume    PerCeNt   PerCeNt
               four segments: Frying Fats,   Fats, Shortenings & Oils      7.47%   $1,026,504   14.65%  85.35%
               Shortenings, 32.96 percent;
              Salad Oils, 19.21 percent; Oil,   Frying Fats, Shortenings  32.96%   $4,530,167   27.04%  72.96%
               Canola, 13.85 percent; and   Gen. Purpose Fats/Shortenings  3.57%    $490,255   76.11%   23.89%
              Pan Coatings, 11.92 percent.
                                        Oil, Canola                       13.85%   $1,903,679   50.36%  49.64%
                                        Oil, Olive                         6.77%    $931,228   76.68%   23.32%
                 CATEGORY SALES:
                   $13.75 Million       Oil, Soybean                       2.51%    $344,900   100.00%   0.00%
                                        Pan Coatings                      11.92%   $1,637,849   55.46%  44.54%
                SHARE OF DLA TROOP      Salad Oils                        19.21%   $2,640,522   27.25%  72.75%
               SUPPORT TOTAL PRIME      Vegetable Oil/Shortening           1.75%    $240,509   77.43%   22.57%
                VENDOR SUBSISTENCE      Total Fats, Shortenings & Oils                              $13,745,614
                   SALES: 1.01%


                                                                                             Fish & Seafood is the
                                    FISH & SEAFOOD                                         fourth-largest category by
                                                                                           dollar volume, moving back
               CLASS                            Share of  Dollar    CoNuS    oCoNuS        up after slipping to fifth in
                                               Category   Volume    PerCeNt   PerCeNt
                                                                                           2016 from fourth in 2015.
               Catfish (Fresh, Frozen)          13.73%  $12,221,631   39.49%   60.51%      Sales rose 10.39 percent in
               Clams (Canned/Fresh/Frozen)       0.24%     $213,066   67.83%   32.17%      2017, or $8.38 million from
               Cod (Dried/ Fresh/Frozen)         6.49%   $5,776,056   72.16%   27.84%     $80,667,075 million in 2016.
                                                                                         It ranks 13th with 16 segments,
               Crab (Canned/Fresh/Frozen)        7.83%   $6,974,034   42.00%   58.00%    down one from 17 in 2016 and
               Fish & Seafood                    2.34%   $2,082,786   0.16%    99.84%       up from 16th in 2015.
               Flounder (Fresh/Frozen)           0.11%     $93,589   80.98%    19.02%
                                                                                         More than half of sales (55.92
               Halibut (Fresh/Frozen)            2.61%   $2,325,326   52.46%   47.54%      percent) are concentrated
               Lobster (Fresh/Frozen)            6.97%   $6,208,608   49.53%   50.47%     into three segments: Shrimp
               Pollack (Fresh/Frozen)            8.07%   $7,184,749   61.35%   38.65%      (Canned/Cooked/Frozen),
                                                                                          30.49 percent; Catfish (Fresh,
               Salmon (Canned/Fresh/Frozen)     11.70%  $10,420,185   52.24%   47.76%     Frozen), 13.73 percent; and
               Scallops (Fresh/Frozen)           1.05%     $939,335   54.99%   45.01%       Salmon (Canned/Fresh/
                                                                                            Frozen), 11.70 percent.
               Shrimp (Canned/Cooked/Frozen)    30.49%  $27,150,705   35.02%   64.98%
               Sole (Fresh/Frozen)               0.02%     $21,246    0.00%   100.00%
               Trout (Fresh/Frozen)              2.38%   $2,120,919   4.49%    95.51%
               Tuna (Canned/Fresh/Frozen)        5.85%   $5,210,048   38.04%   61.96%
                                                                                          —Continued
                                                                     GOVERNMENT FOOD SERVICE • AUGUST 2018 17