Page 13 - gfs0818_Magazine
P. 13

SPV MARKET TRENDS


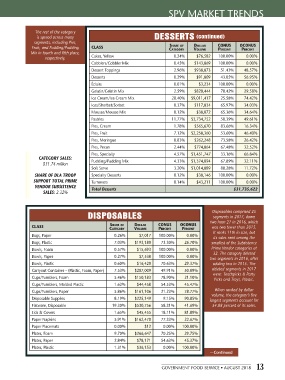
                The rest of the category
                 is spread across many                            DESSERTS          (continued)
               segments, including Pies,
                                                                         Share of
                                                                                   Dollar
               Fruit, and Pudding/Pudding   CLASS                        Category  Volume    CoNuS    oCoNuS
                                                                                                       PerCeNt
                                                                                             PerCeNt
              Mix in fourth and fifth place,
                    respectively.       Cakes, Yellow                      0.24%     $76,582   100.00%   0.00%
                                        Cobblers/Cobbler Mix               0.45%    $143,869   100.00%   0.00%
                                        Dessert Toppings                   2.96%    $938,873   51.43%   48.57%
                                        Desserts                           0.29%     $91,809   43.05%   56.95%
                                        Éclairs                            0.01%      $3,234   100.00%   0.00%
                                        Gelatin/Gelatin Mix                2.59%    $820,444   70.42%   29.58%
                                        Ice Cream/Ice Cream Mix           28.40%   $9,011,417   25.58%  74.42%
                                        Ices/Sherbet/Sorbet                0.37%    $117,834   65.97%   34.03%
                                        Mousse/Mousse Mix                  0.12%     $38,072   65.36%   34.64%
                                        Pastries                          11.77%   $3,734,752   50.39%  49.61%
                                        Pies, Cream                        1.78%    $565,670   83.66%   16.34%
                                        Pies, Fruit                        7.12%   $2,258,360   53.60%  46.40%
                                        Pies, Meringue                     0.83%    $262,248   73.58%   26.42%
                                        Pies, Pecan                        2.44%    $774,864   67.48%   32.52%
                                        Pies, Specialty                    4.57%   $1,451,747   33.16%  66.84%
                 CATEGORY SALES:        Pudding/Pudding Mix                4.33%   $1,374,094   67.89%  32.11%
                   $31.74 million
                                        Soft Serve                         3.20%   $1,014,889   88.28%  11.72%
                SHARE OF DLA TROOP      Specialty Desserts                 0.12%     $38,146   100.00%   0.00%
               SUPPORT TOTAL PRIME      Turnovers                          0.14%     $43,211   100.00%   0.00%
                VENDOR SUBSISTENCE      Total Desserts                                              $31,735,622
                   SALES: 2.32%


                                      DISPOSABLES                                          Disposables comprised 25
                                                                                           segments in 2017, down
                                                                                          two from 27 in 2016, which
               CLASS                            Share of  Dollar    CoNuS    oCoNuS        was two fewer than 2015.
                                               Category   Volume    PerCeNt   PerCeNt
                                                                                           It ranks 11th in size, but
               Bags, Paper                       0.26%      $7,017   100.00%    0.00%
                                                                                           its sales rank among the
              Bags, Plastic                      7.03%     $193,180   73.30%   26.70%     smallest of the Subsistence
               Bowls, Foam                       0.57%     $15,693   100.00%    0.00%     Prime Vendor categories at
                                                                                           32. The category deleted
               Bowls, Paper                      0.27%      $7,538   100.00%    0.00%     two segments in 2016, after
               Bowls, Plastic                    0.60%     $16,420   70.63%    29.37%      adding two in 2015. The
               Carryout Container – (Plastic, Foam, Paper)  7.53%   $207,009   49.91%  50.09%  deleted segments in 2017
                                                                                           were: Toothpicks & Party
               Cups/Tumblers, Foam               5.46%     $150,183   78.90%   21.10%       Picks and Trays, Plastic.
               Cups/Tumblers, Molded Plastic     1.62%     $44,458   54.53%    45.47%
               Cups/Tumblers, Paper              5.86%     $161,106   21.23%   78.77%       When ranked by dollar
                                                                                          volume, the category’s five
               Disposable Supplies               8.19%     $225,149   9.15%    90.85%     largest segments account for
               Flatware, Disposable             19.30%     $530,756   58.31%   41.69%      54.88 percent of its sales.
               Lids & Covers                     1.65%     $45,455   18.11%    81.89%
               Paper Napkins                     5.91%     $162,470   77.33%   22.67%
               Paper Placemats                   0.00%         $12    0.00%   100.00%
               Plates, Foam                      9.70%     $266,647   70.25%   29.75%
               Plates, Paper                     2.84%     $78,171   54.63%    45.37%
               Plates, Plastic                   1.31%     $36,153    0.00%   100.00%
                                                                                          —Continued

                                                                     GOVERNMENT FOOD SERVICE • AUGUST 2018 13
   8   9   10   11   12   13   14   15   16   17   18