
Page 8 - gfs0818_Magazine
P. 8
SPV MARKET TRENDS
BAKERY & BAKING PRODUCTS (continued)
CLASS Share of Dollar CoNuS oCoNuS
Category Volume PerCeNt PerCeNt
Stuffing Mix 0.60% $443,495 70.66% 29.34%
Sugar (Bakery Products) 3.86% $2,845,192 34.07% 65.93%
Sweet Roll, Danish, Pastry (Dough/Mix) 1.24% $916,652 73.94% 26.06%
Tart Shells 0.00% $1,209 100.00% 0.00%
Yeast 0.16% $115,174 47.31% 52.69%
Total Bakery & Baking Products $73,729,940
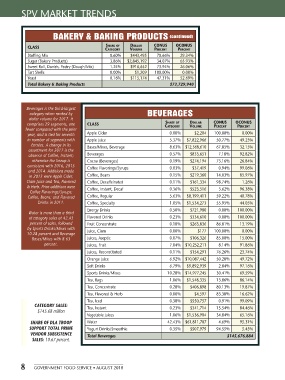
Beverages is the third-largest
category when ranked by BEVERAGES
dollar volume for 2017. It
comprises 29 segments, one CLASS Share of Dollar CoNuS oCoNuS
fewer compared with the prior Category Volume PerCeNt PerCeNt
year, and is tied for seventh Apple Cider 0.00% $2,204 100.00% 0.00%
in number of segments with Apple Juice 5.37% $7,822,966 50.77% 49.23%
Entrées. A change in its Bases/Mixes, Beverage 8.63% $12,568,610 67.85% 32.15%
assortment for 2017 is the
absence of Coffee, Instant; Beverages 0.57% $833,651 7.18% 92.82%
otherwise the lineup is Cocoa (Beverages) 0.19% $274,194 73.16% 26.84%
consistent with 2016, 2015 Coffee Flavorings/Syrups 0.03% $37,419 0.94% 99.06%
and 2014. Additions made
in 2013 were Apple Cider, Coffee, Beans 0.15% $219,360 14.03% 85.97%
Clam Juice and Tea, Flavored Coffee, Decaffeinated 0.11% $161,334 98.74% 1.26%
& Herb. Prior additions were Coffee, Instant, Decaf 0.36% $523,516 3.62% 96.38%
Coffee Flavorings/Syrups;
Coffee, Beans; and Flavored Coffee, Regular 5.63% $8,199,411 59.22% 40.78%
Drinks in 2011. Coffee, Specialty 1.05% $1,534,273 55.95% 44.05%
Energy Drinks 0.50% $721,980 0.00% 100.00%
Water is more than a third
of category sales at 42.43 Flavored Drinks 0.23% $334,610 0.00% 100.00%
percent of sales, followed Fruit Concentrate 0.18% $263,836 86.81% 13.19%
by Sports Drinks/Mixes with Juice, Clam 0.00% $177 100.00% 0.00%
10.28 percent and Beverage
Bases/Mixes with 8.63 Juices, Aseptic 0.07% $106,326 85.00% 15.00%
percent. Juices, Fruit 7.04% $10,252,211 8.14% 91.86%
Juices, Reconstituted 0.11% $154,291 76.26% 23.74%
Orange Juice 6.92% $10,087,442 50.28% 49.72%
Soft Drinks 6.79% $9,892,939 2.84% 97.16%
Sports Drinks/Mixes 10.28% $14,977,245 30.41% 69.59%
Tea, Bags 1.06% $1,548,335 13.86% 86.14%
Tea, Concentrate 0.28% $406,898 80.13% 19.87%
Tea, Flavored & Herb 0.00% $4,597 83.38% 16.62%
Tea, Iced 0.38% $550,757 0.91% 99.09%
CATEGORY SALES: Tea, Instant 0.23% $341,714 15.54% 84.46%
$145.68 million
Vegetable Juices 1.06% $1,536,904 34.84% 65.16%
SHARE OF DLA TROOP Water 42.43% $61,811,707 4.69% 95.31%
SUPPORT TOTAL PRIME Yogurt Drinks/Smoothie 0.35% $507,979 94.55% 5.45%
VENDOR SUBSISTENCE Total Beverages $145,676,884
SALES: 10.67 percent.
8 GOVERNMENT FOOD SERVICE • AUGUST 2018