
Page 17 - gfs0817_Magazine
P. 17
SECTION HEAD
MARKET TRENDS
SUBSISTENCE PRIME
VENDOR SALES IN REVIEW
efense Logistics Agency All 35 Categories
D(DLA) Troop Support in TOP CATEGORIES
Philadelphia, Pa., held 53 and Segment BY DOLLAR VOLUME
prime vendor contracts with
21 food distributors world- Breakdowns in Each CATEGORY % OF SALES DOLLAR VOLUME
wide in calendar 2016. An- Meat 20.76% $262,116,319
nual combined subsistence Poultry 10.90% $137,640,890
sales for fiscal 2017 through June are $1.86 billion and for all of fiscal Beverages 9.93% $125,397,545
2016 were $2.3 billion, which includes subsistence and food service Vegetables 6.47% $81,678,293
operating supplies supplied by prime vendors, as well as contracting Fish & Seafood 6.39% $80,667,075
efforts outside of the Subsistence Prime Vendor program. TOP 5 CATEGORIES 54.46% $687,500,122
One2OneUS LLC, based in Maple Shade, N.J., tracks military
sales and National Allowance Pricing Agreement (NAPA) allowance Bakery & Baking Products 5.51% $69,525,851
information so that DLA Troop Support can monitor monthly sales Fruits 4.31% $54,424,094
of food, food service equipment and supplies. Entrées 3.62% $45,694,255
The listings on the following pages recap Subsistence Prime Vendor Eggs 3.54% $44,638,728
(SPV) sales by category from Jan. 1, 2016, through Dec. 31, 2016. Dairy Products 2.72% $34,350,293
The data breaks down 35 food categories by class (or segment), per- NEXT 5 CATEGORIES 19.70% $248,633,345
TOP 10 CATEGORIES 74.16% $936,133,467
SPV SALES BY CATEGORY
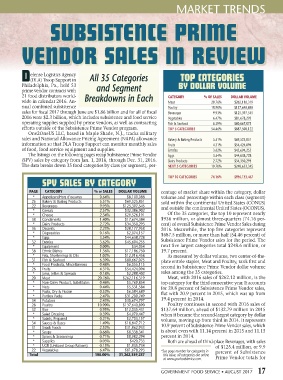
PAGE CATEGORY % Of SALES DOLLAR VOLUME centage of market share within the category, dollar
* Appetizers/Hors d’oeuvres 0.64% $8,109,088 volume and percentage within each class (segment)
26 Bakery & Baking Products 5.51% $69,525,851 sold within the continental United States (CONUS)
22 Beverages 9.93% $125,397,545 and outside the continental United States (OCONUS).
* Cereals 2.57% $32,386,902
* Cheese 2.34% $29,526,191 Of the 35 categories, the top 10 represent nearly
38 Condiments 1.40% $17,674,384 $936 million, or almost three-quarters (74.16 per-
* Dairy Products 2.72% $34,350,293 cent) of overall Subsistence Prime Vendor Sales during
36 Desserts 2.23% $28,177,958 2016. Meanwhile, the top five categories represent
* Disposables 0.16% $2,074,157 $687.5 million, or more than half (54.46 percent) of
* Eggs 3.54% $44,638,728
32 Entrées 3.62% $45,694,255 Subsistence Prime Vendor sales for the period. The
* Equipment 0.00% $34,054 next five largest categories total $248.6 million, or
38 Ethnic Dishes 1.36% $17,186,750 19.7 percent.
* Fats, Shortenings & Oils 1.02% $12,916,458 As measured by dollar volume, two center-of-the-
31 Fish & Seafood 6.39% $80,667,075 plate entrée staples, Meat and Poultry, rank first and
* Food Products, Miscellaneous 0.48% $6,055,115 second in Subsistence Prime Vendor dollar volume
26 Fruits 4.31% $54,424,094
* Jams, Jellies & Spreads 0.18% $2,288,402 sales among the 35 categories.
20 Meat 20.76% $262,116,319 Meat, with 2016 sales of $262.12 million, is the
* Non-Dairy Product, Substitutes 0.46% $5,769,854 top category for the third consecutive year. It accounts
* Nuts 0.44% $5,531,584 for 20.8 percent of Subsistence Prime Vendor sales,
* Pasta, Dry & Frozen 0.52% $6,584,689 flat with 20.9 percent in 2015, which was up from
* Portion Packs 2.47% $31,209,749
34 Potatoes 2.43% $30,674,797 19.4 percent in 2014.
28 Poultry 10.90% $137,640,890 Poultry continues in second with 2016 sales of
32 Rice 0.95% $12,035,431 $137.64 million, ahead of $132.79 million in 2015
* Salad Dressing 0.39% $4,979,447 when it became the second-largest category by dollar
* Salads, Prepared 0.21% $2,703,157 volume, moving up from third in 2014. It represents
34 Sauces & Bases 1.49% $18,847,712 10.9 percent of Subsistence Prime Vendor sales, which
31 Snack Foods 2.52% $31,862,933
* Soups 0.66% $8,338,341 is about even with 11.14 percent in 2015 and 11.15
* Spices & Seasonings 0.71% $8,982,294 percent in 2014.
* Supplies 0.03% $420,733 Both are ahead of third-place Beverages, with sales
* UGR (Unitized Group Rations) 0.15% $1,835,734 of $125.4 million, or 9.9
22 Vegetables 6.47% $81,678,293 *See page number for categories in percent of Subsistence
Total 100.00% $1,262,339,257 this issue, all categories are online
at www.govfoodservice.com. Prime Vendor totals for
GOVERNMENT FOOD SERVICE • AUGUST 2017 17