Page 29 - gfs0818_Magazine
P. 29

SPV MARKET TRENDS


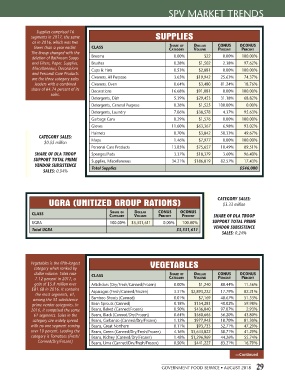
                Supplies comprised 16
              segments in 2017, the same                           SUPPLIES
               as in 2016, which was two
                                                                                   Dollar
                                                                         Share of
               fewer than a year earlier.   CLASS                        Category  Volume    CoNuS    oCoNuS
                                                                                             PerCeNt
                                                                                                       PerCeNt
              The lineup changed with the
               deletion of Bathroom Soaps   Brooms                         0.00%        $22    0.00%   100.00%
               and Filters, Paper. Supplies,   Brushes                     0.28%      $1,502   2.38%    97.62%
               Miscellaneous, Decorations   Caps & Hats                    0.53%      $2,881   0.00%   100.00%
               and Personal Care Products
               are the three category sales   Cleaners, All Purpose        3.65%     $19,942   25.63%   74.37%
                leaders with a combined   Cleaners, Oven                   0.64%      $3,480   81.24%   18.76%
              share of 64.74 percent of its   Decorations                 16.68%     $91,081   0.00%   100.00%
                      sales.
                                        Detergents, Dish                   5.39%     $29,453   31.18%   68.82%
                                        Detergents, General Purpose        0.28%      $1,525   100.00%   0.00%
                                        Detergents, Laundry                7.06%     $38,578   4.37%    95.63%
                                        Garbage Cans                       0.29%      $1,576   0.00%   100.00%
                                        Gloves                            11.60%     $63,367   6.98%    93.02%
                                        Hairnets                           0.70%      $3,842   50.33%   49.67%
                 CATEGORY SALES:
                    $0.55 million       Mops                               1.46%      $7,977   0.00%   100.00%
                                        Personal Care Products            13.85%     $75,657   10.49%   89.51%
                SHARE OF DLA TROOP      Sponges/Pads                       3.37%     $18,379   3.60%    96.40%
               SUPPORT TOTAL PRIME      Supplies, Miscellaneous           34.21%    $186,819   82.57%   17.43%
                VENDOR SUBSISTENCE      Total Supplies                                                $546,080
                   SALES: 0.04%


                      UGRA (UNITIZED GROUP RATIONS)                                          CATEGORY SALES:
                                                                                               $3.33 million

               CLASS                            Share of  Dollar    CoNuS    oCoNuS
                                               Category   Volume    PerCeNt   PerCeNt      SHARE OF DLA TROOP
               UGRA                             100.00%   $3,331,611   0.00%  100.00%      SUPPORT TOTAL PRIME
                                                                                           VENDOR SUBSISTENCE
               Total UGRA                                                   $3,331,611
                                                                                               SALES: 0.24%


              Vegetables is the fifth-largest                    VEGETABLES
               category when ranked by
                dollar volume. Sales rose   CLASS                        Share of  Dollar    CoNuS    oCoNuS
                7.12 percent in 2017, a                                  Category  Volume    PerCeNt   PerCeNt
                gain of $5.8 million over   Artichokes (Dry/Fresh/Canned/Frozen)  0.00%   $1,240   88.44%  11.56%
              $81.68 in 2016. It contains   Asparagus (Fresh/Canned/Frozen)  3.31%   $2,893,222   17.79%  82.21%
                the most segments, 61,
               among the 35 subsistence   Bamboo Shoots (Canned)           0.01%      $7,169   48.67%   51.33%
               prime vendor categories. In   Bean Sprouts (Canned)         0.18%    $154,281   40.02%   59.98%
              2016, it comprised the same   Beans, Baked (Canned/Frozen)   0.50%    $436,040   97.07%    2.93%
               61 segments. Sales in the   Beans, Black (Canned/Dry/Frozen)  0.64%   $560,665   56.20%  43.80%
               category are widely spread   Beans, Garbanzo (Canned/Dry/Frozen)  1.12%   $977,945   18.70%  81.30%
              with no one segment scoring   Beans, Great Northern          0.11%     $93,733   52.71%   47.29%
              over 10 percent. Leading the   Beans, Green (Canned/Dry/Fresh/Frozen)  4.16%   $3,643,822   58.71%  41.29%
              category is Tomatoes (Fresh/  Beans, Kidney (Canned/Dry/Frozen)  1.48%   $1,296,969   44.26%  55.74%
                 Canned/Dry/Frozen)     Beans, Lima (Canned/Dry/Fresh/Frozen)  0.50%   $441,227   83.21%  16.79%


                                                                                                     —Continued
                                                                     GOVERNMENT FOOD SERVICE • AUGUST 2018 29
   24   25   26   27   28   29   30   31   32