
Page 27 - gfs0818_Magazine
P. 27
SPV MARKET TRENDS
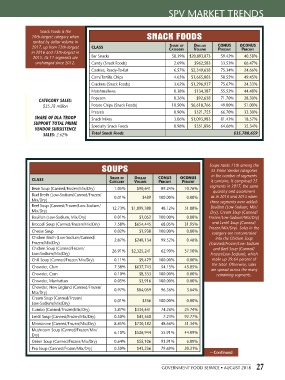
Snack Foods is the
10th-largest category when SNACK FOODS
ranked by dollar volume in
2017, up from 12th-largest CLASS Share of Dollar CoNuS oCoNuS
in 2016 and 15th-largest in Category Volume PerCeNt PerCeNt
2015. Its 11 segments are Bar Snacks 58.39% $20,893,873 59.42% 40.58%
unchanged since 2012. Candy (Snack Foods) 2.69% $962,583 33.53% 66.47%
Cookies, Ready-To-Eat 6.57% $2,349,638 75.34% 24.66%
Corn/Tortilla Chips 4.65% $1,665,003 50.55% 49.45%
Crackers (Snack Foods) 3.62% $1,296,937 75.67% 24.33%
Marshmallows 0.38% $134,387 55.52% 44.48%
Popcorn 0.26% $92,638 71.70% 28.30%
CATEGORY SALES:
$35.78 million Potato Chips (Snack Foods) 18.50% $6,618,766 49.00% 51.00%
Pretzels 0.90% $321,755 66.70% 33.30%
SHARE OF DLA TROOP Snack Mixes 3.06% $1,093,983 81.43% 18.57%
SUPPORT TOTAL PRIME Specialty Snack Foods 0.98% $351,096 64.66% 35.34%
VENDOR SUBSISTENCE
SALES: 2.62% Total Snack Foods $35,780,659
SOUPS Soups ranks 11th among the
35 Prime Vendor categories
in the number of segments
CLASS Share of Dollar CoNuS oCoNuS it contains. It comprised 25
Category Volume PerCeNt PerCeNt
segments in 2017, the same
Bean Soup (Canned/Frozen/Mix/Dry) 1.05% $90,641 89.24% 10.76% quantity and assortment
Beef Broth (Low-Sodium/Canned/Frozen/ as in 2016 and 2015 when
Mix/Dry) 0.01% $489 100.00% 0.00% three segments were added:
Beef Soup (Canned/Frozen/Low-Sodium/ Bouillon (Low-Sodium, Mix/
Mix/Dry) 12.73% $1,099,388 48.12% 51.88% Dry), Cream Soup (Canned/
Bouillon (Low-Sodium, Mix/Dry) 0.01% $1,052 100.00% 0.00% Frozen/Low-Sodium/Mix/Dry)
Broccoli Soup (Canned/Frozen/Mix/Dry) 7.58% $654,445 68.05% 31.95% and Lentil Soup (Canned/
Frozen/Mix/Dry). Sales in the
Cheese Soup 0.02% $1,938 100.00% 0.00% category are concentrated
Chicken Broth (Low-Sodium/Canned/ into the Chicken Soup
Frozen/Mix/Dry) 2.87% $248,134 99.52% 0.48% (Canned/Frozen/Low-Sodium
Chicken Soup (Canned/Frozen/ and Beef Soup (Canned/
Low-Sodium/Mix/Dry) 26.91% $2,325,241 62.90% 37.10% Frozen/Low-Sodium), which
Chili Soup (Canned/Frozen/Mix/Dry) 0.11% $9,479 100.00% 0.00% make up 39.64 percent of
the total. Otherwise, sales
Chowder, Clam 7.38% $637,743 54.15% 45.85%
are spread across the many
Chowder, Corn 0.10% $8,333 100.00% 0.00% remaining segments.
Chowder, Manhattan 0.05% $3,916 100.00% 0.00%
Chowder, New England (Canned/Frozen/ 0.97% $84,059 96.36% 3.64%
Mix/Dry)
Cream Soup (Canned/Frozen/ 0.01% $536 100.00% 0.00%
Low-Sodium/Mix/Dry)
Gumbo (Canned/Frozen/Mix/Dry) 3.87% $334,441 74.26% 25.74%
Lentil Soup (Canned/Frozen/Mix/Dry) 0.50% $43,560 7.23% 92.77%
Minestrone (Canned/Frozen/Mix/Dry) 8.45% $730,182 48.66% 51.34%
Mushroom Soup (Canned/Frozen/Mix/ 6.10% $526,944 55.91% 44.09%
Dry)
Onion Soup (Canned/Frozen/Mix/Dry) 0.64% $55,106 93.91% 6.09%
Pea Soup (Canned/Frozen/Mix/Dry) 0.50% $43,236 79.69% 20.31%
—Continued
GOVERNMENT FOOD SERVICE • AUGUST 2018 27