
Page 23 - gfs0818_Magazine
P. 23
SPV MARKET TRENDS
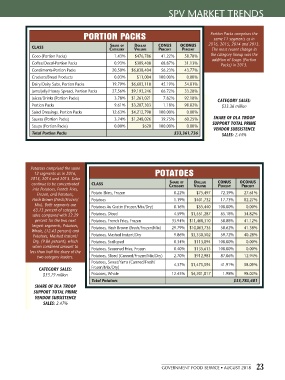
PORTION PACKS Portion Packs comprises the
same 11 segments as in
CLASS Share of Dollar CoNuS oCoNuS 2016, 2015, 2014 and 2013.
Category Volume PerCeNt PerCeNt The most recent change in
Coco (Portion Packs) 1.43% $476,786 41.22% 58.78% the category lineup was the
addition of Soups (Portion
Coffee/Decaf-Portion Packs 0.93% $309,408 68.87% 31.13% Packs) in 2013.
Condiments-Portion Packs 20.50% $6,838,404 56.23% 43.77%
Crackers/Bread Products 0.03% $11,004 100.00% 0.00%
Dairy/Dairy Subs, Portion Packs 19.79% $6,603,118 45.19% 54.81%
Jams/Jelly/Honey Spread, Portion Packs 27.56% $9,193,246 66.72% 33.28%
Juices/Drinks (Portion Packs) 3.78% $1,261,021 7.82% 92.18%
CATEGORY SALES:
Portion Packs 9.61% $3,207,303 1.18% 98.82% $33.36 million
Salad Dressings, Portion Packs 12.63% $4,212,798 100.00% 0.00%
Sauces (Portion Packs) 3.74% $1,248,026 39.75% 60.25% SHARE OF DLA TROOP
SUPPORT TOTAL PRIME
Soups (Portion Packs) 0.00% $620 100.00% 0.00%
VENDOR SUBSISTENCE
Total Portion Packs $33,361,736 SALES: 2.44%
Potatoes comprised the same
12 segments as in 2016, POTATOES
2015, 2014 and 2013. Sales
continue to be concentrated CLASS Share of Dollar CoNuS oCoNuS
into Potatoes, French Fries, Category Volume PerCeNt PerCeNt
Frozen, and Potatoes, Potato Skins, Frozen 0.22% $75,497 72.39% 27.61%
Hash Brown (Fresh/Frozen/ Potatoes 1.19% $401,732 17.73% 82.27%
Mix). Both segments are Potatoes Au Gratin (Frozen/Mix/Dry) 0.16% $55,440 100.00% 0.00%
63.73 percent of category
sales compared with 22.29 Potatoes, Diced 4.59% $1,551,287 65.18% 34.82%
percent for the two next Potatoes, French Fries, Frozen 33.94% $11,468,310 58.88% 41.12%
largest segments, Potatoes, Potatoes, Hash Brown (Fresh/Frozen/Mix) 29.79% $10,063,735 58.62% 41.38%
Whole, (12.43 percent) and
Potatoes, Mashed Instant/ Potatoes, Mashed Instant/Dry 9.86% $3,330,502 59.72% 40.28%
Dry, (9.86 percent), which Potatoes, Scalloped 0.34% $113,894 100.00% 0.00%
when combined amount to Potatoes, Seasoned Fries, Frozen 0.40% $135,613 100.00% 0.00%
less than half the share of the
two category leaders. Potatoes, Sliced (Canned/Frozen/Mix/Dry) 2.70% $912,981 87.06% 12.94%
Potatoes, Sweet/Yams (Canned/Fresh/ 4.37% $1,475,594 41.91% 58.09%
CATEGORY SALES: Frozen/Mix/Dry)
$33.79 million Potatoes, Whole 12.43% $4,201,017 1.98% 98.02%
Total Potatoes $33,785,601
SHARE OF DLA TROOP
SUPPORT TOTAL PRIME
VENDOR SUBSISTENCE
SALES: 2.47%
GOVERNMENT FOOD SERVICE • AUGUST 2018 23