
Page 26 - gfs0818_Magazine
P. 26
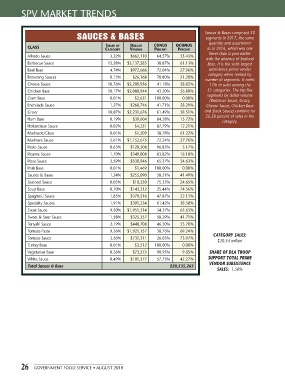
SPV MARKET TRENDS


                                  SAUCES & BASES                                        Sauces & Bases comprised 30
                                                                                        segments in 2017, the same
                                                                                         quantity and assortment
             CLASS                            Share of  Dollar    CoNuS    oCoNuS        as in 2016, which was one
                                              Category  Volume    PerCeNt   PerCeNt
                                                                                         fewer than a year earlier
             Alfredo Sauce                      3.22%    $662,110   64.57%   35.43%
                                                                                        with the absence of Seafood
             Barbecue Sauce                    15.28%   $3,137,585   38.87%  61.13%      Base. It is the sixth-largest
             Beef Base                          4.74%    $972,666   72.04%   27.96%      subsistence prime vendor
                                                                                         category when ranked by
             Browning Sauces                    0.13%     $26,168   78.80%   21.20%
                                                                                        number of segments. It ranks
             Cheese Sauce                      10.76%   $2,209,956   41.18%  58.82%      17th in sales among the
             Chicken Base                      10.17%   $2,088,944   43.20%  56.80%      35 categories. The top five
                                                                                         segments by dollar volume
             Clam Base                          0.01%      $2,631   100.00%   0.00%
                                                                                          (Barbecue Sauce, Gravy,
             Enchilada Sauce                    1.27%    $260,746   41.71%   58.29%     Cheese Sauce, Chicken Base
             Gravy                             10.87%   $2,231,676   61.49%  38.51%     and Steak Sauce) combine for
                                                                                        56.58 percent of sales in the
             Ham Base                           0.19%     $39,604   84.28%   15.72%
                                                                                               category.
             Hollandaise Sauce                  0.02%      $4,251   87.79%   12.21%
             Marinade/Glaze                     0.01%      $1,509   38.78%   61.22%
             Marinara Sauce                     5.61%   $1,152,675   72.24%  27.76%
             Pesto Sauce                        0.63%    $128,508   96.83%    3.17%
             Picante Sauce                      1.70%    $349,008   83.82%   16.18%
             Pizza Sauce                        2.59%    $530,946   65.37%   34.63%
             Pork Base                          0.01%      $1,469   100.00%   0.00%
             Sauces & Bases                     1.24%    $255,090   58.51%   41.49%
             Seafood Sauce                      0.05%     $10,550   75.35%   24.65%
             Soup Base                          0.70%    $143,312   25.44%   74.56%
             Spaghetti Sauce                    1.85%    $379,516   47.87%   52.13%
             Specialty Sauces                   1.91%    $391,234   61.42%   38.58%
             Steak Sauce                        9.50%   $1,951,314   34.37%  65.63%
             Sweet & Sour Sauce                 1.58%    $325,357   58.29%   41.71%
             Teriyaki Sauce                     2.19%    $448,708   46.30%   53.70%
             Tomato Paste                       9.36%   $1,921,157   30.76%  69.24%
             Tomato Sauce                       3.56%    $731,311   26.03%   73.97%        CATEGORY SALES:
                                                                                             $20.54 million
             Turkey Base                        0.01%      $2,512   100.00%   0.00%
             Vegetarian Base                    0.36%     $73,375   90.95%    9.05%      SHARE OF DLA TROOP
             White Sauce                        0.49%    $101,377   57.73%   42.27%      SUPPORT TOTAL PRIME
             Total Sauces & Base                                         $20,535,265     VENDOR SUBSISTENCE
                                                                                             SALES:  1.50%


          26   GOVERNMENT FOOD SERVICE • AUGUST 2018