Page 28 - gfs0818_Magazine
P. 28

SPV MARKET TRENDS


                                                                   SOUPS        (continued)


                                      CLASS                            Share of  Dollar    CoNuS     oCoNuS
                                                                       Category  Volume    PerCeNt   PerCeNt
                                      Potato Soup (Canned/Frozen/Mix/Dry)  3.54%   $305,580   73.32%  26.68%
                CATEGORY SALES:       Seafood Bisques (Frozen)           0.03%      $3,001   100.00%   0.00%
                  $8.64 million       Soups                              3.68%    $318,222   31.72%   68.28%
                                      Tomato Soup (Canned/Frozen/
              SHARE OF DLA TROOP      Low-Sodium/Mix/Dry)                6.84%    $591,147   46.89%   53.11%
             SUPPORT TOTAL PRIME      Vegetable Soup (Canned/Frozen/Mix/Dry)  6.05%   $522,544   44.46%  55.54%
              VENDOR SUBSISTENCE      Total Soups                                                  $8,639,357
                 SALES: 0.63%


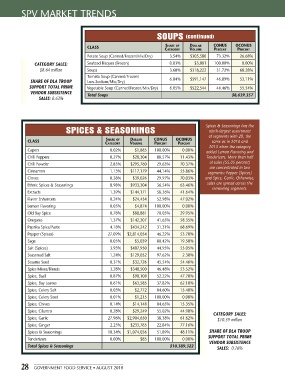
                             SPICES & SEASONINGS                                        Spices & Seasonings has the
                                                                                         ninth-largest assortment
                                                                                         of segments with 28, the
             CLASS                            Share of  Dollar    CoNuS    oCoNuS          same as in 2016 and
                                              Category  Volume    PerCeNt   PerCeNt
                                                                                         2015 when the category
             Capers                             0.02%      $1,885   100.00%   0.00%     added Lemon Flavoring and
             Chili Peppers                      0.27%     $28,304   88.57%   11.43%     Tenderizers. More than half
             Chili Powder                       2.85%    $295,760   29.63%   70.37%       of sales (55.05 percent)
                                                                                          are concentrated in two
             Cinnamon                           1.13%    $117,179   44.14%   55.86%      segments: Pepper (Spices)
             Cloves                             0.38%     $39,026   29.97%   70.03%     and Spice, Garlic. Otherwise,
             Ethnic Spices & Seasonings         8.98%    $933,304   36.54%   63.46%      sales are spread across the
                                                                                           remaining segments.
             Extracts                           1.39%    $144,171   58.36%   41.64%
             Flavor Enhancers                   0.24%     $24,454   52.98%   47.02%
             Lemon Flavoring                    0.05%      $4,874   100.00%   0.00%
             Old Bay Spice                      0.78%     $80,881   70.05%   29.95%
             Oregano                            1.37%    $142,307   41.65%   58.35%
             Paprika Spice/Paste                4.18%    $434,242   31.31%   68.69%
             Pepper (Spices)                   27.09%   $2,814,054   46.22%  53.78%
             Sage                               0.05%      $5,039   80.42%   19.58%
             Salt (Spices)                      3.93%    $407,950   44.95%   55.05%
             Seasoned Salt                      1.24%    $129,052   97.62%    2.38%
             Sesame Seed                        0.31%     $32,726   45.54%   54.46%
             Spice Mixes/Blends                 3.28%    $340,500   46.48%   53.52%
             Spice, Basil                       0.87%     $90,108   52.22%   47.78%
             Spice, Bay Leaves                  0.61%     $63,585   37.82%   62.18%
             Spice, Celery Salt                 0.03%      $2,772   84.60%   15.40%
             Spice, Celery Seed                 0.01%      $1,215   100.00%   0.00%
             Spice, Chives                      0.14%     $14,148   84.65%   15.35%
             Spice, Cilantro                    0.28%     $29,249   55.02%   44.98%
                                                                                           CATEGORY SALES:
             Spice, Garlic                     27.96%   $2,904,650   38.38%  61.62%          $10.39 million
             Spice, Ginger                      2.25%    $233,765   22.84%   77.16%
             Spices & Seasonings               10.34%   $1,074,036   51.89%  48.11%      SHARE OF DLA TROOP
                                                                                         SUPPORT TOTAL PRIME
             Tenderizers                        0.00%        $85   100.00%    0.00%
                                                                                         VENDOR SUBSISTENCE
             Total Spices & Seasonings                                   $10,389,322
                                                                                             SALES:  0.76%

          28   GOVERNMENT FOOD SERVICE • AUGUST 2018
   23   24   25   26   27   28   29   30   31   32